Projects
Manage workflows in Alviss AI with projects as self-contained workspaces for datasets, models, and insights.
Alviss AI organizes workflows around projects, each serving as a self-contained workspace for managing datasets, models, and derived insights. Users have flexibility in structuring projects to suit their analysis needs—for instance, creating separate projects per country for isolated views or a single global project for cross-regional visualizations. A key constraint is that all data within a project must maintain uniform granularity (e.g., daily, weekly) to ensure compatibility.
There will be a cap on the total number of allowed projects for a team; this is tied to the agreed pricing package for the team.
Viewing and Switching Projects
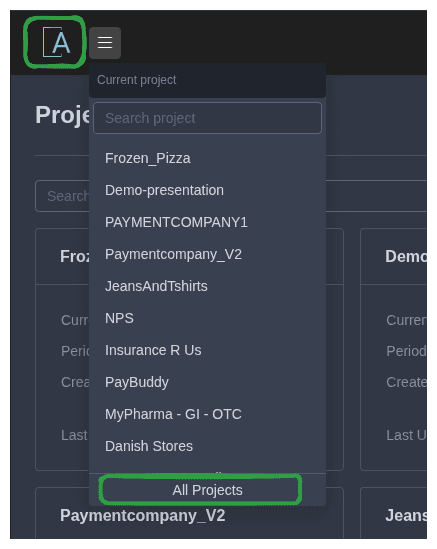
Access the project list via the side menu, where all team projects are displayed. This interface allows seamless switching between projects. All team members have full access to every project in the team.
- Navigate by clicking the Alviss AI logo to reach the project list page.
- Alternatively, use the project switcher dropdown menu and select "All Projects" at the bottom.
Creating a Project
One needs to have the user role of Manager or Admin in order to be able to create new projects and to access project settings.
To create a new project:
- From the project list, click "New Project."
During creation, specify:
- Project Name: A descriptive identifier for the project.
- Data Periodicity: The time granularity (e.g., daily, weekly) as defined in Data Periodicity. This setting is permanent and cannot be altered later.
Projects created within a team are immediately accessible to all team members. For team management details, see Teams.
Project Settings
Project settings allow modifications to core attributes and dashboard behaviors. Access settings from the project dashboard or list.
General Modifications
- Update the project name or display currency (note: currency changes affect only the unit symbol, not underlying values).
- Delete the project if it's no longer needed (this action is irreversible and removes all associated datasets, models, and insights).
Dashboard Configuration
Customize dashboard experiences to align with team workflows and data presentation needs.
Activities Dashboard Data Source
Select the dataset source for the Activities dashboard:
- Same as Effects Dashboard: Ensures consistency between Activities and Effect dashboards by using the active attributionset-linked dataset.
- Use Active Dataset: Displays the most recent [Active Dataset](./Data/Datasets#Active Dataset) ideal for previewing new data before attributions are generated.
Default Filters
Define preset filters applied automatically upon loading dashboards. These are visible and editable by users, making them suitable for standard views (e.g., excluding secondary KPIs like "Revenue" to avoid double-counting in sales-based plots). Configurable separately for Activities and Effect dashboards.
Pre-Filters
Apply hidden filters that process data before it reaches the dashboards. These are invisible to end users, useful for permanently excluding sensitive or irrelevant variables without affecting user interactions.
Menu Permissions
Control visibility of dashboard elements to tailor the user experience:
- Disable specific tabs or sections in Activities and Effect dashboards.
- Hide individual plots or areas via the floating button in the bottom-right corner of the dashboard.
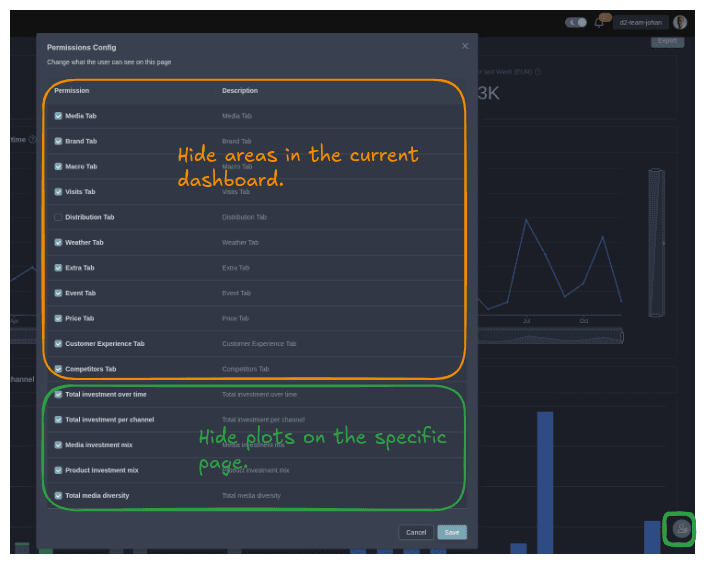
Changes apply to the current page; navigate to other pages to adjust their elements. These settings ensure team members see only relevant information, enhancing focus and security.
For related workflows, refer to Getting Started or Datasets. If integrating programmatically, see API for project endpoints.
Predictions
Forecast future outcomes in Alviss AI using Predictions to project KPIs like sales or revenue based on customizable drivers. Set variables for granular control, run multiple scenarios for comparisons, and analyze results with time-series graphs, confidence intervals, and filters. Leverage for demand preparation, strategy optimization, and integration with attributions or optimizations.
Response Curves
Visualize variable impacts on KPIs with Response Curves in Alviss AI, identifying ex. saturation points.