Simulations
Compare scenarios against baselines in Alviss AI Simulations to uncover optimal actions and synergies, highlighting differences in KPIs like revenue or churn.
Unlike Predictions, which emphasize absolute future outcomes for tasks like demand forecasting, Simulations highlight differences between scenarios to reveal optimal actions and synergies across activities.
Scenario vs. Baseline
At the heart of Simulations is the comparison between a scenario and a baseline:
- Scenario: The experimental condition you wish to test, such as increasing media investments by a specific amount or pattern.
- Baseline: The reference condition for comparison, like zero investment or maintaining historical levels.
This setup isolates the effects of changes, answering questions like: "What additional revenue would result from boosting marketing spend compared to the status quo?"
Running a Simulation
To create and run a Simulation:
- Navigate to Simulations: Access the Simulations section via the side menu in the Alviss AI platform.
- Set Variables: Select the variables to include (e.g., media channels, pricing, or macroeconomic factors). Unselected variables default to their dataset values.
- Configure Scenario and Baseline:
- Define values, patterns, and scaling for each variable in both the scenario and baseline.
- Scenario Example: Set media investments to a targeted total spend with a historical pattern.
- Baseline Example: Set media investments to zero to measure the absence of activity.
- Run the Simulation: Click "Run Simulation" to process it in the background. Results will be available once complete.
Modifying Scenario and Baseline
The variable configuration interface is designed for quick setup while offering granular control over each variable at every time point. Below is a walkthrough of key functionalities, with numbered references to the interface elements.
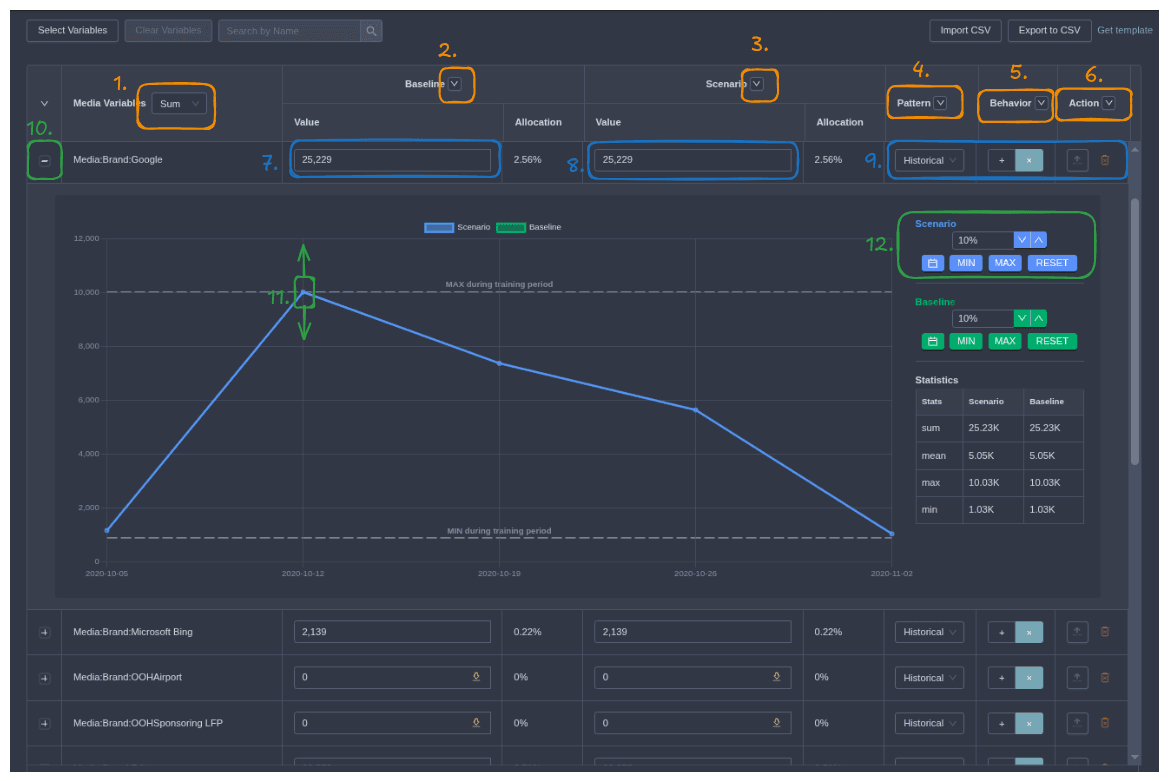
- For each variable group, decide whether to enter values as the
sumor themeanover the time period. For media investments, sum is usually preferred; for variables like weather, mean is often more relatable (think temperature). - Quick action buttons allow you to set the entire baseline to zero, the historical minimum per variable, or the historical maximum per variable.
- The same quick actions as in 2, but for the scenario.
- Control the pattern of the variable's behavior:
- Historical: Mirrors the exact historical pattern, scaled up or down based on your specified value.
- Constant: Uniform value every epoch, summing (or averaging, depending on setting in 1) to the specified value.
- Custom: Applies if you manually adjust values.
- Choose how to scale the pattern to match your set value:
- Additive: Shifts values up or down by a constant—useful for variables like unemployment rate or temperature.
- Multiplicative: Applies proportional scaling—ideal for preserving zeros in patterns like media spend.
- By default, values are enforced within historical min and max bounds. To simulate beyond these (e.g., for exploratory scenarios), enable this option for the variable group to allow values outside historical limits.
- Enter the baseline value for the entire period, as either the
Sumor theMeanbased on the setting in 1. - Same as 7, but for the scenario.
- At the variable level, control the pattern (as in 4), scaling behavior (as in 5), historical bounds adherence (as in 6), or remove the variable from the simulation (it will then use dataset defaults).
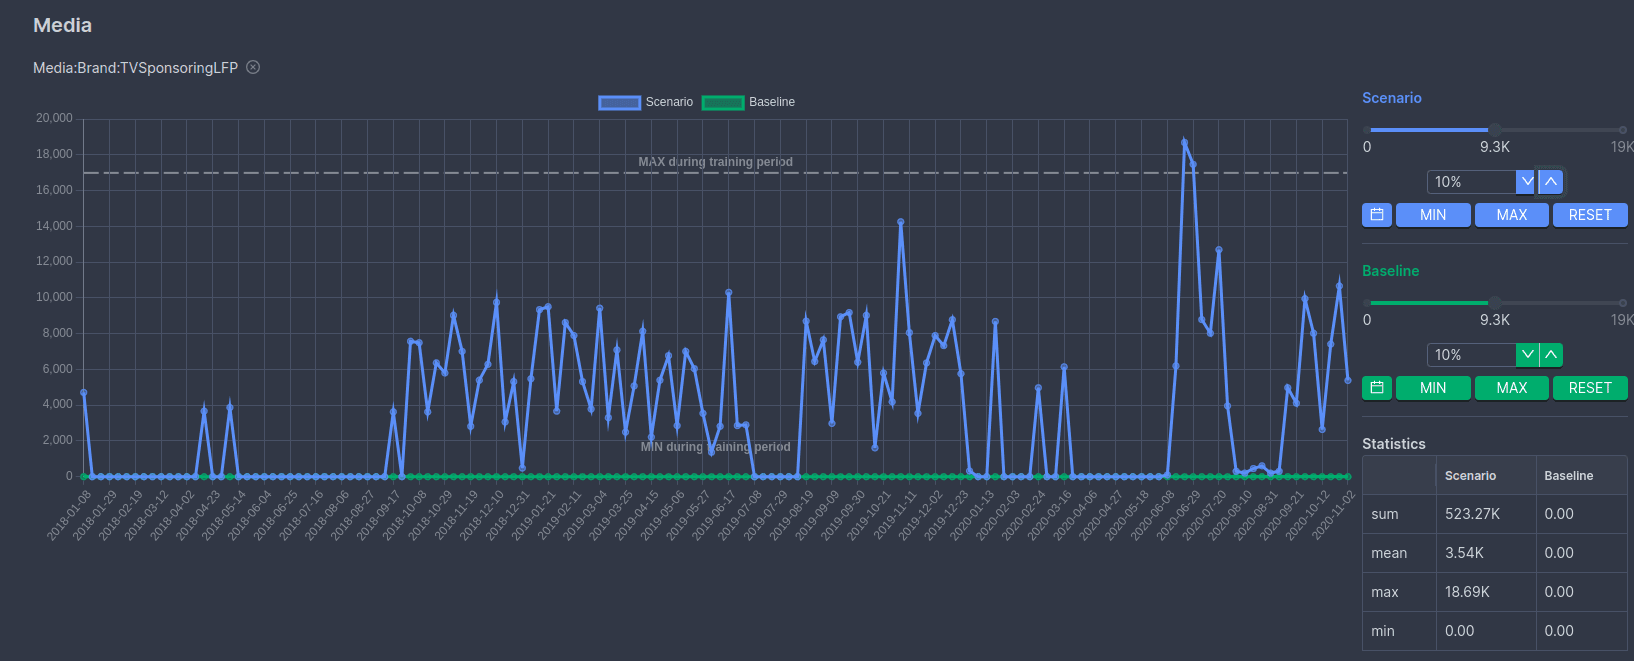
- Expand a variable to view its values per data point—useful for testing patterns. The view includes historical min/max in the plot, plus a statistical summary of baseline and scenario settings.
- Manually drag points on the graph to set specific values; this switches the pattern to
Custom. - Within each variable's scenario or baseline, use buttons to shift values up/down by a percentage, set to min/max, reset, or load data from a different time period.
If setting values outside historical bounds triggers a warning, resolve it by enabling out-of-bounds, deforming the pattern to fit, or enforcing bounds strictly.
Understanding the Results
Once complete, results are displayed in three tabs for easy analysis:
- Scenario Results: Outcomes under the experimental conditions.
- Baseline Results: Outcomes under the reference conditions.
- Difference Analysis: The delta (Scenario minus Baseline), emphasizing incremental impacts like added revenue or reduced churn.
Visualizations include totals, time-series trends, cumulative effects, and uncertainty estimates. Switch between graphs and tables, apply Filtering, and hover for tooltips.
Utilizing Simulation Insights
Simulations drive strategic optimization by revealing potential outcomes:
- Compare media plans to maximize ROI.
- Test pricing adjustments for impact on sales and churn.
- Evaluate synergies between marketing and external factors.
Integrate with features like Attributions for impact breakdowns, Optimizations for budget recommendations, and Response Curves for variable sensitivities. For a step-by-step example, see the Run a Simulation tutorial.
Response Curves
Visualize variable impacts on KPIs with Response Curves in Alviss AI, identifying ex. saturation points.
Teams
Collaborate in Alviss AI with team-based workflows for shared access to resources like compute, storage, and datasets. Administer members via invites/removals, exit or delete teams, and integrate via API for efficient model development and data reliability.