Run An Optimization
Run an Optimization in Alviss AI to automatically find the best variable settings like media budgets that maximize or meet your KPI goals under constraints.
Having completed:
you are now ready to run an Optimization. This tutorial guides you through using the Optimization feature to automatically determine the best variable settings—such as media budgets—for achieving your goals, like maximizing sales while adhering to constraints. Optimizations save time over manual adjustments in Simulations or Predictions by algorithmically tuning variables based on your models and dataset.
If you're focused on "what-if" comparisons, check out Run a Simulation. For absolute forecasts, see Run a Prediction.
Prerequisites
- An active project with a Dataset and trained Model.
- Access to the Optimizations section (team role-dependent; see Permissions and Roles).
Step 1: Start a New Optimization
Navigate to Optimizations in the side menu and click "New Optimization."
Set the basic configurations:
- Name (Optional): Enter a descriptive name, or let Alviss AI generate one.
- Modeling Combination: Select from available options.
- Advanced Options (If Available): Choose a specific model and dataset.
Step 2: Set Date Range
Define the optimization period, including optional pre- and post-periods for greater accuracy:
- Pre-period: Accounts for prior data influencing the start (e.g., carry-over from previous media investments).
- Post-period: Captures lingering effects after the period (e.g., adstock on future KPIs).
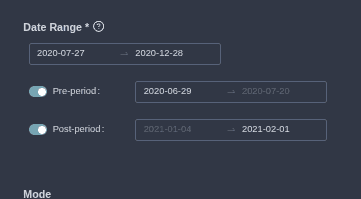
Example: Optimize over the next quarter, with a 1-month pre-period and 1-month post-period.
Step 3: Select Mode
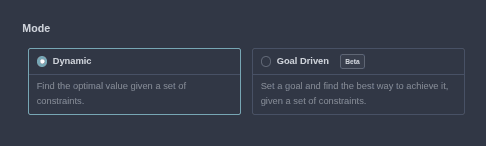
Choose between:
- Dynamic Optimization: Automatically maximizes or minimizes your target KPI (e.g., maximize revenue).
- Goal-Driven Optimization: Aims for a specific target value, either absolute (e.g., exactly 10,000 sales) or relative (e.g., 20% more sales than baseline).
For this example, we'll use Dynamic Optimization to maximize sales by optimizing media spend.
Step 4: Define Target
Select your KPI (e.g., sales or revenue).
- For Dynamic: Choose "Maximize" or "Minimize."
- For Goal-Driven: Set the goal value and specify absolute or relative.
In our example: Maximize sales.
Step 5: Select Optimization Variables
Choose variables to adjust (e.g., media channels like TV or digital ads). Unselected variables retain their dataset values.
For this tutorial, select all media-related variables.
Variables like media often have carry-over effects—consider including pre- and post-periods to account for them.
Step 6: Add Constraints
Set sum-based constraints over the time period using >, <, or = operators. Group multiple variables if needed (e.g., total media budget ≤ $100,000).
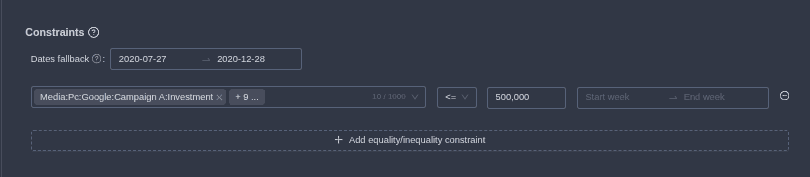
Example: Set total media spend ≤ 500,000 to enforce a budget cap.
Constraints are highly flexible and can be combined for scenarios like:
- Minimum spend across several channels.
- Front-loading a campaign.
Step 7: Set Boundary Constraints (Optional)
To prevent extreme values, apply per-time-point boundaries. If you want to stay close to historical limits, you can skip this step.
Options include:
- Max: Upper limit (e.g., $5,000 per day on TV).
- Min: Lower limit (e.g., $0).
- Threshold Max: If above the threshold, jump to Max (for step functions; requires Max to be set, with threshold < Max).
- Threshold Min: If below the threshold, jump to Min (requires Min to be set, with threshold > Min).
Step 8: Set Directions (Goal-Driven Only, Optional)
For Goal-Driven mode, specify desired trends for variables while hitting the target:
- Minimize: Reduce the variable as much as possible (e.g., minimize media spend to achieve the goal).
- Maximize: Increase it.
- Neutral: No preference (or leave unset).
Skip this for Dynamic mode.
Step 9: Run and Review
Click "Submit" to run the optimization in the background. You'll be redirected to the optimization's detail page to monitor progress.
Once complete, review the results, which include both the optimized scenario and a baseline simulation using default dataset values for comparison:
- Optimized Values: Recommended settings for each variable.
- Outcome Analysis: KPI improvements vs. baseline, with graphs for totals, time-series trends, and cumulative effects.
- Tools: Toggle between graphs and tables, enable uncertainty visualization.
For conceptual details, refer to Optimizations.